

Summary
Table 9 Summary of Development in the South West
| Number of Undertakings1 |
Local Authority Undertakings |
Number of Power Stations |
Generating Capacity (kW) |
Per Capita Consumption (kWh) |
|
| 1900 | 6 | 6 | 6 | .. | .. (4)3 |
| 1912 | 30 | 8 | 28 | .. | .. (36) |
| 1925/6 | 42 | 10 | 37 | 97,311 | 69 (133) |
| 1935/6 | 53 | 11 | 35 | 276,101 | 190 (374) |
| 1948/9 | .. | .. | 27 | 537,8752 | 543 (821) |
| 1958/9 | – | .. | 13 | 1,140,4892 | 1,321 (1,765)4 |
Notes:
1 Excludes all non-statutory undertakings.
2 Includes Castle Meads, Gloucester power station.
3 Great Britain 1900-1948/9 from Leslie Hannah, Electricity Before Nationalisation: a study of the electricity supply industry in Britain to 1948 (London: Macmillan, 1979), pp.427-8.
4 Calculated from data in Electricity Council, Handbook of Electricity Supply Statistics 1977, p. 63 and census returns.
Sources: Tables 2-4.
Table 9 shows various indicators of the growth of electrification from 1900. The six undertakings in that year were all local authorities. All the companies then were non-statutory, illustrating the importance of that type of organisation in the earlier phases of development. Three of the six municipal systems in Bath, Exeter and Taunton had also begun as non-statutory organizations. The number of undertakings grew rapidly from 1900 to 1912 and continued to a peak in the mid-1930s when consolidation began. Power station numbers show a similar pattern but peaked in 19925-26 when bulk supply agreements resulted in the closure of small generating stations. Rationalisation increased sharply after 1948-49.
A sense of the rapid growth of demand from the mid-1920s is illustrated by the two final columns in the table. Economies of scale are reflected in the increasing size of power stations. The largest station in 1925-26, Feeder Road, Bristol had an installed capacity of 35,390 kW. A decade later the new Portishead station had 92,900 kW. By 1948-49 further extensions had raised the capacity to 24,150 kW. The new Portishead B station had a capacity of 325,000 kW in 1958-59.
Per capital consumption in the South West (with Great Britain in parentheses) shows substantial rates of growth. Without large power-consuming industries, however, the region always lagged below national levels. Bristol (149 kWh in 1925-26 and 392 in 1935-36) was one of the few places above the national average.
Electrification was a much slower process than the enthusiastic promoters of the 1880s expected. Much effort and expenditure were needed to create viable electricity undertakings in the larger urban centres. This point was reached about 1900 but extending the benefits of electricity over wider areas took much longer and universal electricity was probably not achieved until the 1950s.
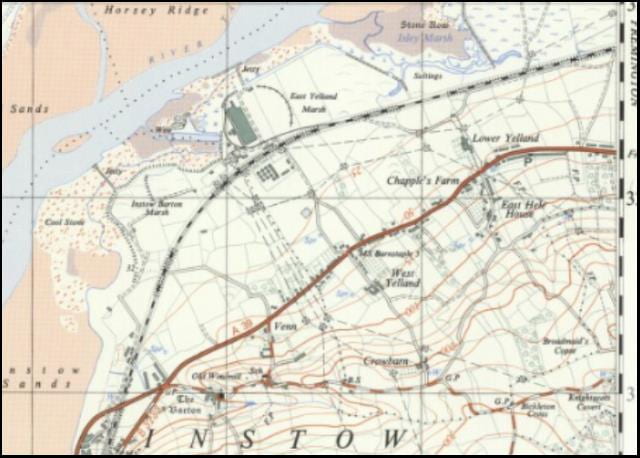
EAST YELLAND POWER STATION
An early postwar station connected to the grid by a network of transmission lines First 30,000kW turbine commissioned in 1953. Well located in relation to cooling water and coal supplies by collier or railway.
Ordnance Survey, 1:25,000 Map series. Sheet SS 43, 1961 (National Library of Scotland)